Service Design Case Study · Johns Hopkins University

Redesigning the end-to-end service that turns grades into real financial trust.

Stocks in the Future is a Johns Hopkins financial-literacy program that gives under-resourced students in grades 6–12 a simulated stock market funded by their own grades and attendance. As the Service Designer, I mapped the whole service — students, teachers, and the program operations behind them — and redesigned it around the moments where youth were losing trust and leaving.

62%
original drop-off before core tasks were completed
+88%
increase in page-stay and return time
+54%
increase in self-reported youth trust
−35%
abandonment during stock research
100%
task completion on the stock purchase flow
Organization
Johns Hopkins University
Program
Stocks in the Future
My Role
Service Designer (research → delivery)
Actors
Students 6–12, teachers, program admins

I didn't redesign screens. I redesigned how the service earns a student's trust.

The platform was only the visible layer. Behind every student login sat a chain of teachers entering grades and attendance, earnings being calculated, and program staff supporting classrooms. I owned the service view across all of it — and led a cross-functional team of product managers and developers from discovery to a shipped, measurable experience.

Whole-service lensMapped student, teacher, and admin journeys together so fixes in one lane didn't create friction in another.
Research-led prioritizationGrounded every decision in youth-centered personas and the psychology of trust, agency, and engagement.
Outcomes, not outputsTied each journey stage to a metric — so the redesign could be judged by retention and trust, not aesthetics.

Where the student journey broke — and the service moment I designed for each stage.

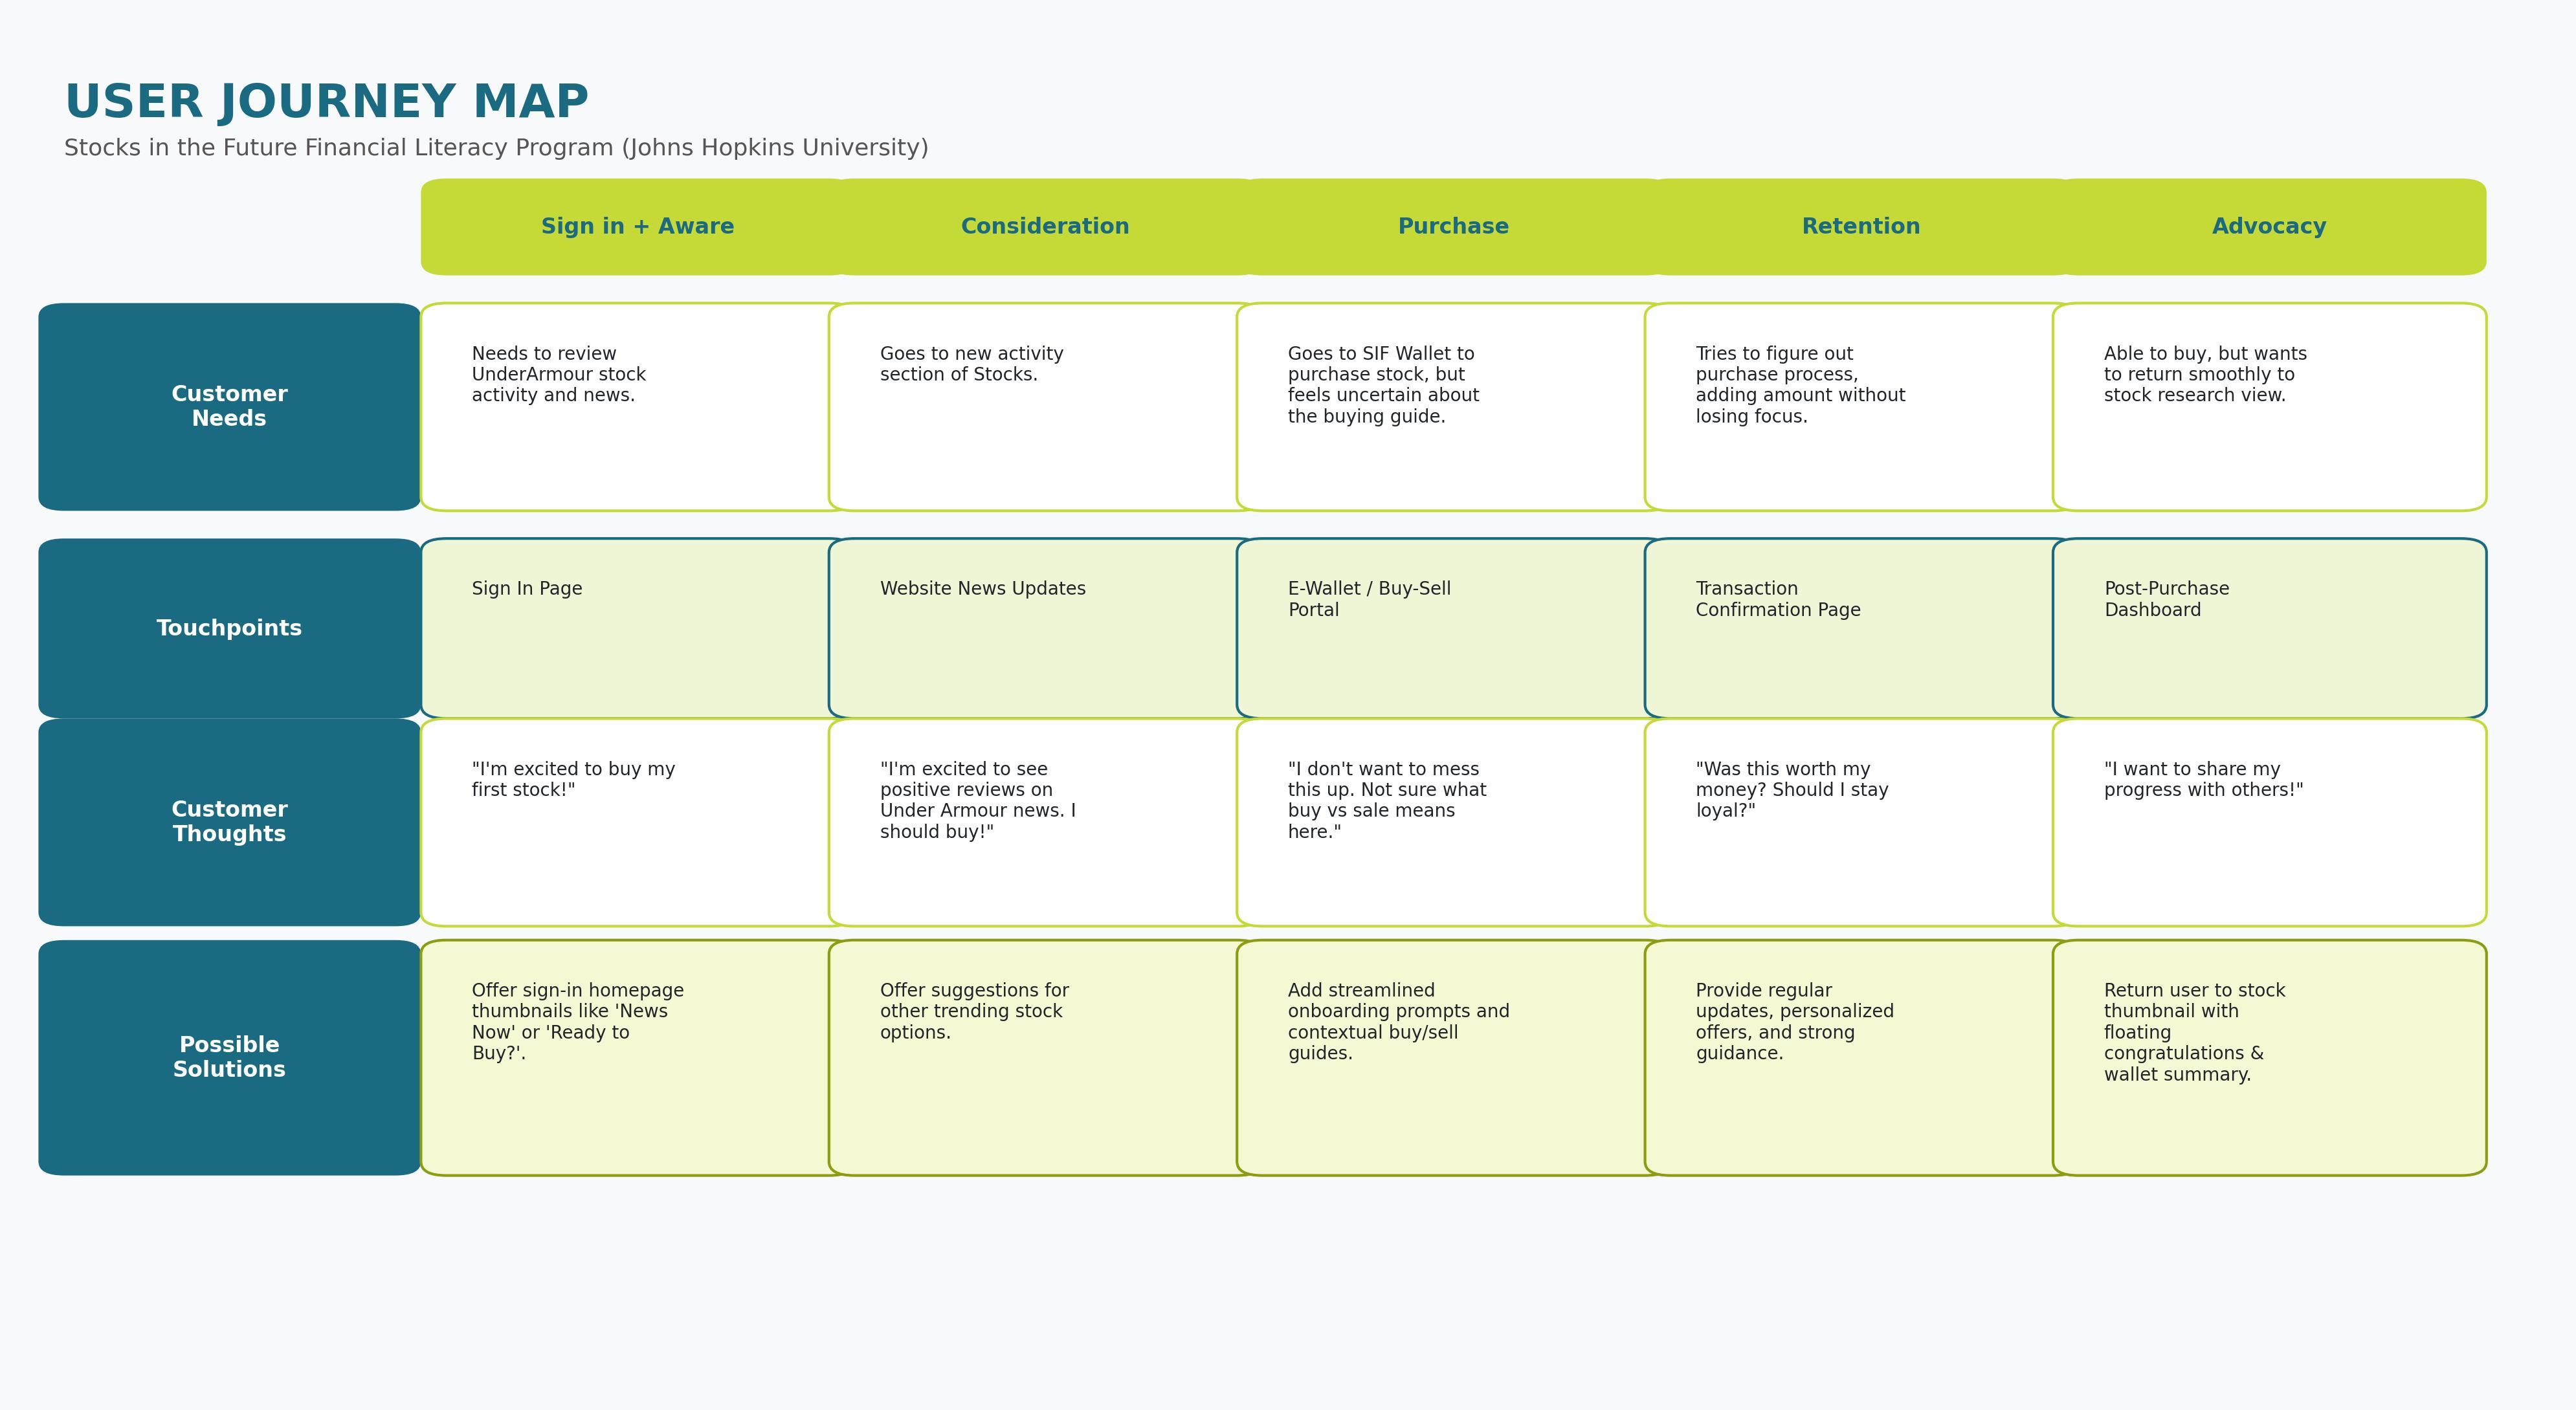
I mapped a student's path from signing in to sharing their progress, capturing needs, touchpoints, and what they were actually thinking. Each stage became a design opportunity, and each opportunity was tied to a result.

Tap a stage to focus it · scroll sideways on mobile →
Stage 1Sign in + Aware
Stage 2Consideration
Stage 3Purchase
Stage 4Retention
Stage 5Advocacy
Student Needs
Needs to review Under Armour stock activity and news.
Goes to the new activity section of Stocks.
Goes to SIF Wallet to purchase stock, but feels uncertain about the buying guide.
Tries to figure out the purchase process, adding an amount without losing focus.
Able to buy, but wants to return smoothly to the stock research view.
Touchpoints
Sign-in page
Website news updates
E-Wallet / Buy-Sell portal
Transaction confirmation page
Post-purchase dashboard
Student Thoughts
“I’m excited to buy my first stock!”
“I’m excited to see positive reviews on Under Armour news. I should buy!”
“I don’t want to mess this up. Not sure what buy vs. sell means here.”
“Was this worth my money? Should I stay loyal?”
“I want to share my progress with others!”
Emotional Curve
Original serviceRedesigned service
Service Solution
Sign-in homepage thumbnails like “News Now” and “Ready to Buy?” point students straight to action.
Suggestions for other trending stocks keep curiosity going and research moving.
Streamlined onboarding prompts and contextual buy/sell guides at the moment of decision.
Regular updates, personalized offers, and real-time, grade-linked earnings feedback.
Return to the stock thumbnail with a floating congratulations and wallet summary.
Measured Impact
62%original drop-off this stage set out to reverse
−35%abandonment during stock research
100%purchase-flow task completion in testing
+88%page-stay and return time
+54%youth trust in the platform
View the original journey map artifact Original user journey map for the Stocks in the Future financial literacy program, showing needs, touchpoints, thoughts, and possible solutions across five stages
Students were leaving before the service ever earned their trust.

The original experience was dense, dated, and administrative — closer to a legacy banking portal than a service built for 6th–12th graders. Cognitive load was high, the link between classroom effort and earnings was invisible, and teachers were stuck in heavy back-office workflows that slowed the whole system down.

0%
original drop-off rate — students disengaging before completing core tasks
Service research surfaced breakdowns in every lane:
  • Students needed clearer guidance and real-time feedback to stay motivated
  • Teachers struggled with rosters, tracking, and attendance — the inputs the whole service runs on
  • The system carried so much information that it buried the moments that mattered

For a program asking youth from under-resourced communities to engage with investing — often for the first time — every touchpoint had to feel approachable before the service could feel credible.

Original Stocks in the Future platform, dense legacy interface with heavy tables

Old vs. new — from a dense, legacy front door to a clean, modern one built to earn trust.

Connecting what students see to the people and systems behind it.

A student's earnings only feel trustworthy if the backstage works. I blueprinted the service so teacher workflows and program operations were redesigned alongside the student experience.

Student actions
Signs inReads stock newsResearches a stockBuys with earned fundsTracks & shares progress
Line of interaction
Frontstage
Homepage thumbnailsTrending stock suggestionsSIF Wallet & buy/sell guidesReal-time earningsWallet summary & celebration
Line of visibility
Backstage
Teachers manage rostersAttendance trackingGrades entered & converted to earnings
Line of internal interaction
Support
Johns Hopkins program teamSimulated market dataProduct & engineering team

Design the service around trust and clarity for youth, not administrative completeness.

I led research and service design across a cross-functional team of product managers and developers, centering the beliefs and behaviors of Black and Brown inner-city youth around agency and engagement.

01

Grounded the service in youth-centered personas

Built personas around under-resourced students' lived experience — economic curiosity, resilience, and trust-building needs — alongside teacher and admin roles in the service.

02

Mapped the journey and blueprinted the service

Charted the student journey stage by stage and connected each touchpoint to the backstage teacher and program workflows that power it.

03

Simplified the information architecture

Rebuilt the sitemap around the most vital content, removing redundant and obsolete information to cut cognitive load for students and teachers.

04

Designed the two critical flows end to end

Students purchasing stock with earned funds, and teachers managing rosters and attendance — the front and back of the same service.

05

Made progress visible and motivating

Introduced real-time earnings, grade-linked stock gains, and clear feedback — so classroom effort felt directly connected to financial progress.

Wireframes for redesigned Stocks in the Future student and teacher portals

Early wireframes — simplified navigation, clearer stock detail views, streamlined admin roster tools.

Service before
  • Dense, table-heavy touchpoints with no visual hierarchy
  • No real-time feedback linking effort to earnings
  • Teacher workflows buried and hard to complete
  • Legacy style with little emotional appeal for youth
Service after
  • Clear entry points at every stage of the journey
  • Real-time earnings and grade-linked gains surfaced instantly
  • Simplified roster and attendance tools for teachers
  • Warm, approachable design that builds youth confidence
Redesigned Stocks in the Future platform, desktop and mobile views, clean modern interface

Final redesigned experience — desktop homepage and mobile student dashboard with real-time earnings.

A service youth stayed with — and trusted with their future.

By fixing the journey stage by stage and the backstage behind it, the redesigned service turned a 62% drop-off problem into measurable gains in engagement, trust, and task success.

0%
Increase in page-stay and return time
Retention stage · measured against the original 62% drop-off
0%
Increase in youth user trust
Advocacy stage · self-reported confidence in the platform
0%
Consideration stage · reduction in abandonment during stock research
0%
Purchase stage · task completion for the stock purchase flow in usability testing

What I bring to a service design engagement.

The same end-to-end practice behind this project, available for teams who need a service that works for the people using it and the people running it.

01

Service & user research

Interviews, contextual inquiry, and persona development grounded in lived experience — especially for underserved audiences.

Deliverables: research synthesis, personas
02

Journey mapping

Stage-by-stage maps of needs, touchpoints, thoughts, and emotions that pinpoint exactly where users lose trust or drop off.

Deliverables: current & future-state journey maps
03

Service blueprinting

Connecting frontstage experiences to backstage staff workflows and support systems so the whole service holds together.

Deliverables: service blueprint, ops recommendations
04

Information architecture

Simplifying sitemaps and content so the most vital information is easy to find and cognitive load drops.

Deliverables: sitemap, content priorities
05

Flow & experience design

End-to-end task flows, wireframes, and high-fidelity designs for the critical moments of a service.

Deliverables: task flows, wireframes, UI
06

Measurement & validation

Usability testing and metric framing that tie every stage of the journey to a measurable outcome.

Deliverables: test plans, impact reporting
Work with me →

For youth, trust is built through a service that's clear at every step.

This program asked students from under-resourced communities to engage with investing — often their first exposure to it — through a service that, in its original form, felt like a legacy administrative tool. The real work wasn't cosmetic: it was finding the exact moments in the journey where confusion turned into doubt, and redesigning both the touchpoint and the backstage behind it.

Mapping the journey, blueprinting the service, and designing flows around how youth actually think led directly to the outcomes that mattered: an 88% increase in how long students stayed engaged against an original 62% drop-off, a 35% reduction in research abandonment, 100% purchase-flow completion in testing, and a 54% increase in how much youth trusted the platform with their financial future.